A screen in a shop window is the only piece of store technology that works on people who have not yet decided to come in. That makes it easy to oversell. This piece collects the numbers that exist on window displays in US retail, from foot-traffic research and sign surveys to brightness specs, electricity prices and local sign codes, and separates measured figures from the ones that only sound measured.
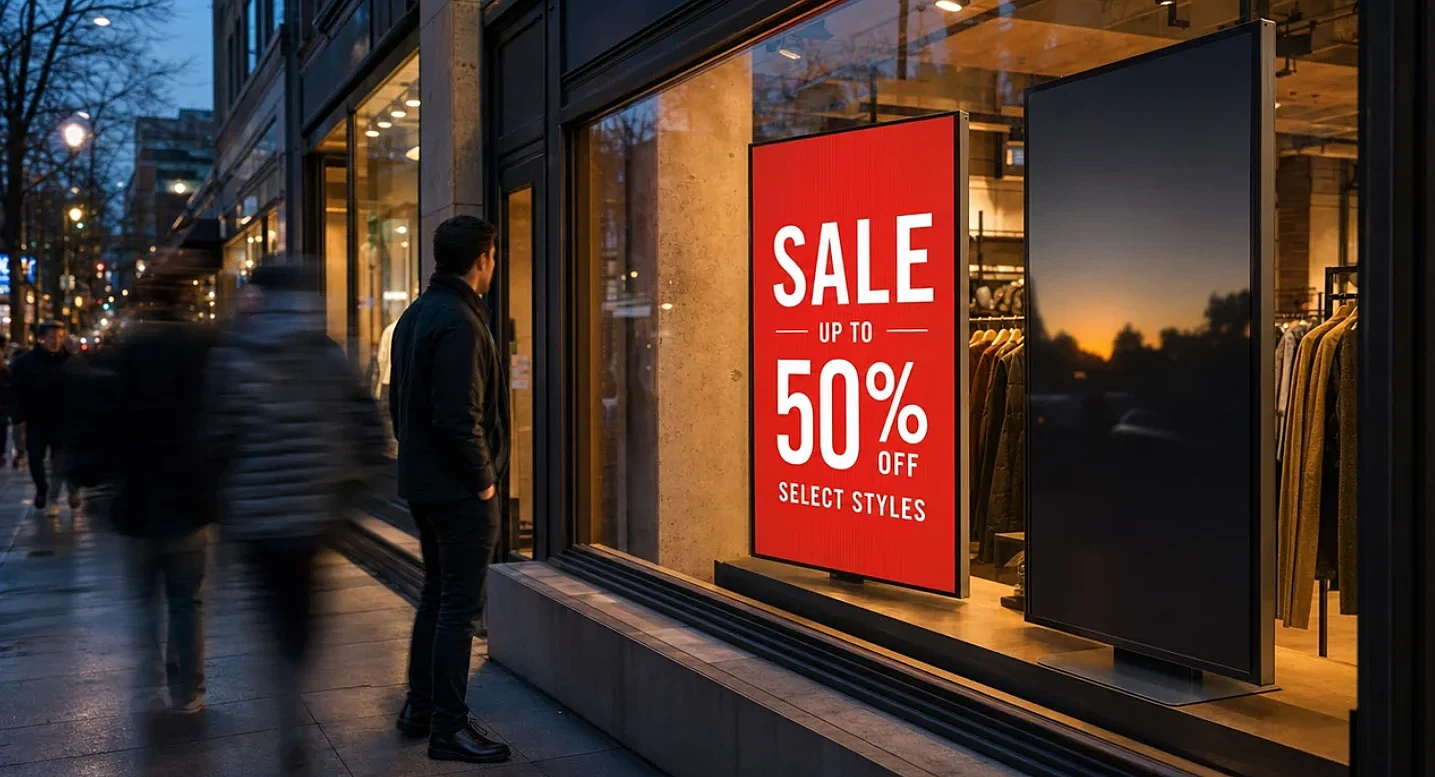
Why Does the Store Window Still Matter When 17% of Sales Are Online?
The store window still matters because physical stores carry most of US retail spending. The Census Bureau put total retail sales at $1,986.5 billion in the second quarter of 2026, seasonally adjusted. E-commerce accounted for $340.2 billion of that, or 17.1%. Online sales grew 12.2% year over year, faster than the 6.7% for retail overall, but roughly 83 cents of every retail dollar still moves through channels where a shopper can walk past a window.
The window also has fewer neighbors to compete with. Coresight Research counted 7,325 US store closures and 5,970 openings in 2024, a net loss of 1,355 locations, and projected about 15,000 closures against roughly 5,800 openings for 2025. A store that stays open on a thinning street keeps more of the passing traffic, if it can stop people.
The most cited evidence that signs stop people is old and was gathered about print. In March 2012, FedEx Office commissioned a phone survey of 914 US adults. Of them, 76% said they had walked into a store they had never visited because of its signs, and 68% said they had bought something because a sign caught their eye. Another 52% said misspelled or poorly made signs made them less willing to enter. These are self-reported answers about printed signage, not observed behavior, but the last figure matters for screens: a panel showing last week's sale, or nothing at all, is a poorly made sign.
That gap between a published campaign and what the glass actually shows is where most window screens fail quietly. A store manager sees the screen once in the morning, and a frozen player at 2 p.m. stays frozen until closing. Newer platforms treat this as a monitoring problem rather than a content problem. For chains running window screens across regions, storefront digital signage for retail stores comes with a remote reboot path: Decker pairs each window screen with a separate Verifier device that confirms the panel is on and showing the current campaign, and a new promotion can go to one store, a region or the whole chain from the same dashboard.
The vendor reports more than 13,700 connected screens on that platform. It is a vendor figure, not an audit, but the design point is the useful part: the system checks the screen, not the upload. If you are comparing platforms more broadly, see also our roundup of the best digital signage software.
How Many Passersby Does a Storefront Display Actually Stop?
A storefront display usually stops a low single-digit share of passersby, and stopping is not the same as buying. The cleanest public data comes from an unexpected place, a field experiment on a service robot at the entrance of a Japanese bedding store, published as a research preprint in January 2026 by Song and colleagues. Over 12 days, the team video-coded more than 62,000 passersby across three conditions.
| Condition | Passersby | Stopped | Entered (of those who stopped) | Bought (of those who stopped) | Bought (of all passersby) |
|---|---|---|---|---|---|
| Normal entrance | 20,180 | 0.73% | 31.97% | 11.56% | 0.084% |
| Robot at the door | 21,938 | 1.50% | 20.12% | 5.49% | 0.082% |
| Robot plus a display fixture | 20,035 | 2.48% | 9.46% | 2.62% | 0.065% |
The attention device more than tripled the stopping rate, from 0.73% to 2.48%. Purchases per passerby did not rise; the differences were not statistically significant. Many of the extra people who stopped were curious, not shopping.
Three lessons carry over to window screens:
- Count the funnel, not the glance. A screen that doubles the number of people who pause can leave sales flat if the content entertains rather than sells.
- Expect small denominators. At a 0.73% stop rate, a street with 2,000 passersby a day gives about 15 people who even pause. Any claimed sales lift has to fit inside that number.
- Measure entry separately. Capture rate, the share of passersby who walk in, is the metric a window can influence most directly. Footfall analytics firms define it as entries divided by passersby and generally decline to publish a universal benchmark, because a commuter corridor and a destination street behave differently.
What the screen shows has to work inside the few seconds a walker gives it. A common legibility rule for signs is about one inch of letter height for every 10 feet of viewing distance, so a headline meant for someone across a 30-foot street needs letters near three inches tall, which on a 55-inch panel leaves room for five or six words. That pushes window content toward one offer per slide: a price, a product and a reason to walk in. Long brand videos and dense price lists, which work on a sales floor where shoppers stand still, mostly go unread through glass.
Timing matters too. A loop of ten slides at eight seconds each takes 80 seconds to cycle, while a pedestrian at normal walking pace crosses a typical 20-foot shopfront in about four to five seconds. Most passersby therefore see one slide, chosen by chance. Retailers who test windows often find that a shorter loop of three or four messages, or a single static offer held for a full hour, beats a long rotation simply because each message gets seen more often.
The robot study is one store and one product category. It is still more rigorous than most window-display claims in circulation, which rarely state a sample, a control or a date.
How Bright Does a Window Screen Need to Be?
A window screen facing the street needs roughly four to eight times the brightness of an indoor display. Display integrators publish a fairly consistent ladder:
| Placement | Typical brightness |
|---|---|
| Indoor wall, away from glass | 350–500 nits |
| Bright atrium or near glass | 500–700 nits |
| In-window, indirect light | 2,000–2,500 nits |
| In-window, direct sun | about 3,000 nits |
| Fully outdoor, sealed | 3,500–4,000 nits |
Brightness is only half of the problem. Sunlight through glass also heats the panel, and a standard LCD that passes its clearing point turns black, because the liquid crystals lose their alignment. Touch-display maker Elo describes this as the usual reason a monitor goes dark in direct sun. Window-rated panels deal with it through heat management: Samsung's 55-inch OM55N-D window display lists 3,000 nits on the street side, 1,000 nits on the in-store side, an operating range of 0 to 40 °C and a built-in overheating-protection routine.
For a store choosing between a consumer TV and a window-rated panel, the practical test is orientation. If the screen faces outward through glass that gets afternoon sun, an indoor panel at 350–500 nits will look washed out by midday and can go black on the hottest afternoons.
What Does a Window Screen Cost to Buy and Run?
A window-rated screen costs several times an indoor display to buy, and it draws several times the power. One integrator lists installed prices of 2,500–5,500 for a single 46- or 55-inch window panel and $4,500 and up for 65- to 75-inch units, with a Samsung 55-inch storefront package starting near $3,950, of which the panel is $2,750.
Power is the line most budgets skip. The OM55N-D lists 500 watts in on-mode. US commercial electricity averaged 14.53 cents per kilowatt-hour in July 2026, up 3.4% from a year earlier, according to EIA data.
| Screen | Power | Hours a day | kWh a year | Cost a year at 14.53¢ |
|---|---|---|---|---|
| Window panel, 55" | 500 W | 14 | 2,555 | about $371 |
| Indoor commercial display, 55" | 130 W | 14 | 664 | about $96 |
| Window panel on a 10-hour schedule | 500 W | 10 | 1,825 | about $265 |
Scheduling matters more than the panel choice here. Cutting four hours a day saves about $106 per window screen per year, and a window screen lit at 3 a.m. on a closed street earns nothing.
The other running cost is time. Every hour a window screen is frozen, on the wrong input or showing an expired offer is an hour of a 3,000–5,000 asset working against the store, in the sense the 2012 survey describes. Few retailers track it, because most content systems only report that a file was delivered.
Do Local Sign Codes Limit What a Window Screen Can Show?
Local sign codes can limit what a window screen shows, and they vary sharply by city. Provo, Utah, offers a concrete example of how detailed the rules can be. Its code for electronic display signs requires each message to stay static. Depending on the zone, the minimum hold time is one hour, one minute, 15 seconds for some multi-tenant buildings, or 8 seconds for signs facing Interstate 15. Transitions must be instant or pass through a black screen for at least a second. Animation, full-motion video, scrolling, flashing and fades are prohibited.
Many codes are written for exterior signs, and whether a screen behind the glass counts as a sign is a local question. Retailers rolling out window screens across several cities usually check three points with each planning office:
- whether interior screens visible from the street fall under the electronic sign rules;
- the minimum message hold time, if any;
- night-time brightness limits, which some codes set separately from daytime levels.
A playlist built for a mall atrium, with fast cuts and motion, can be non-compliant on a street where the same screen faces a sidewalk.
Where Is Retail Screen Spending Heading?
Retail is the top application for digital signage spending, and the screen-based share of out-of-home media keeps rising. Global Market Insights sized the digital signage market at $23.7 billion in 2025, with retail at $9.6 billion, roughly 40%, and the US at $9.2 billion. It projects 8.6% annual growth through 2034.
On the media side, the Out of Home Advertising Association of America reported record revenue of $9.46 billion for 2025, up 3.6%, with digital formats at 36.3% of the total and growing 10.5% a year. Store windows sit at the edge of this market. A window screen on a busy street is, in effect, a small out-of-home placement the retailer already owns, and some chains have started selling that time to brand partners.
The forecasts come from research firms and trade groups with an interest in growth. The direction is consistent across sources; the exact figures are less certain.
What Is Still Unknown, and a Four-Week Test for One Window
The public evidence leaves four questions open, and a single store can answer them for itself in about a month.
Open questions in the data
- No recent, independent US study measures how much a digital window screen changes capture rate compared with a static printed window. The 2012 survey is self-reported and about print.
- Attention and purchase can move in opposite directions, as the 2026 robot study shows. No public study isolates content type, such as price-led versus brand-led loops, on a window screen.
- Dark-screen hours are almost never reported. Vendors publish uptime improvements, but retailers rarely publish baselines.
- Energy and compliance costs are missing from most ROI claims, even though a 500 W panel adds about $370 a year at current commercial rates.
A four-week field protocol for one window
| Week | Window state | What to record |
|---|---|---|
| 1 | Current setup, printed or off | Passersby, entries, transactions per hour |
| 2 | Screen on, price-led loop | Same, plus dark or frozen minutes |
| 3 | Screen off, printed poster back | Same as week 1 |
| 4 | Screen on, brand-led loop | Same as week 2 |
The metrics to compute each day:
- Capture rate = entries ÷ passersby.
- Conversion = transactions ÷ entries.
- Sales per passerby = revenue ÷ passersby. This is the number the robot study used, and the one that tells whether attention turned into money.
- Lit-hour availability = hours the screen showed the scheduled content ÷ scheduled hours. Below 97% on a 14-hour day, the screen is dark more than 150 hours a year.
- Energy per lit hour = metered kWh ÷ lit hours, priced at the store's own tariff.
Sample size sets the limit on what one window can prove. With 2,000 passersby a day and a stop rate near the 0.73% baseline above, a week yields about 100 people who pause and, at a typical capture rate, a few hundred entries. That is enough to see a change in capture rate of a couple of points, but not a 2% change in sales per passerby. A store that wants a sales answer should run the alternating schedule for eight weeks instead of four, or pool the same test across three or four similar locations.
A door counter with a separate passerby line, the screen's own uptime log and the POS are enough to run it. Alternating weeks rather than comparing two stores keeps location effects out of the result. If sales per passerby do not move across weeks 2 and 4, the screen is a branding expense, and its budget should be judged that way.
Sources
- Quarterly Retail E-Commerce Sales, 2nd Quarter 2026, U.S. Census Bureau
- From Metrics to Meaning: Insights from a Mixed-Methods Field Experiment on Retail Robot Deployment, Song et al., arXiv, January 2026
- OAAA Reports OOH Advertising Rose 3.6% In 2025, MediaPost, March 2026