How to use the marketing statistics feature
Now you can analyze traffic from visitors connecting with you. This resource allows a better visualization of the visitors' sources, promoting a more efficient organization and, as a result, a better job done with traffic analysis by your clients.
For better usability, the information can be classified as follows:
- Period
- Visitors Source
- Regions
- Channels
The new section is available under the "Statistics" -> "Marketing Statistics" tab. Only account administrators and employees with supervisor rights have access to this tab.
Note: Marketing statistics are available on PRO and Enterprise plans.
How to use the Marketing Statistics feature#
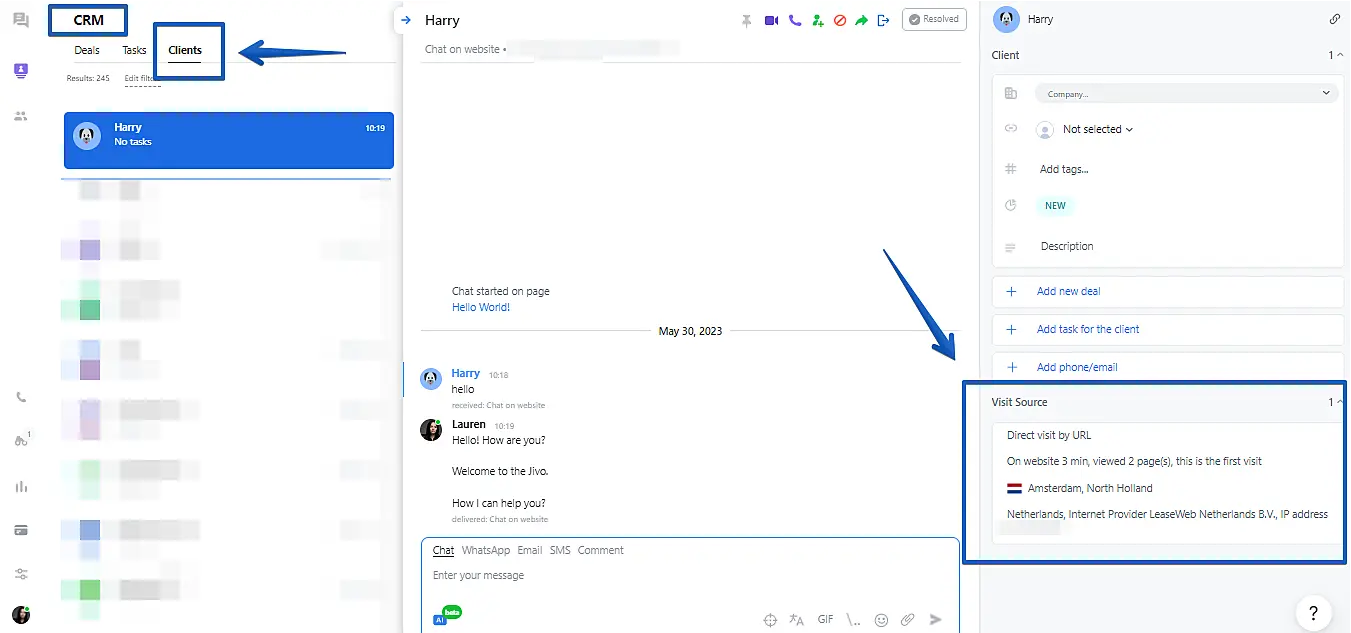
Marketing statistics include information about visitors, which you can view by going to CRM -> Clients-> Visit Source
Statistics include data on new customers.
Here's how it works: Let's say a customer contacted us via website chat in January and again in April. What will be taken into consideration is always the customer's last source of access, that is, if in January he made contact in São Paulo, and in April in Argentina, Argentina will appear, as that is the exact location he is in that moment, although it has already come into contact at other times.
Data about visitor sources#
In the lower right corner of the chat window, in each conversation in the "Contact Center", you can find some details about the visit. It is this data that fits the graphs in the marketing statistics tab.
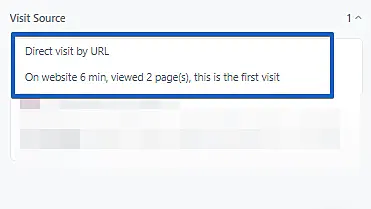
Then you will have the possibility to check what is paid traffic and direct visits to the site. Other referral sources are determined based on UTM tags.
The list will show the top referral sources and the number of times that customer has visited.
Data about regions#
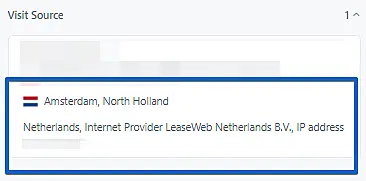
In the same session, information about the city and region where the customer is located will be displayed. Marketing statistics take into account data about the region.
The list will show you the top 100 regions for your account.
An example of using Marketing Statistics**#
New marketing statistics let you track how many leads come from each source
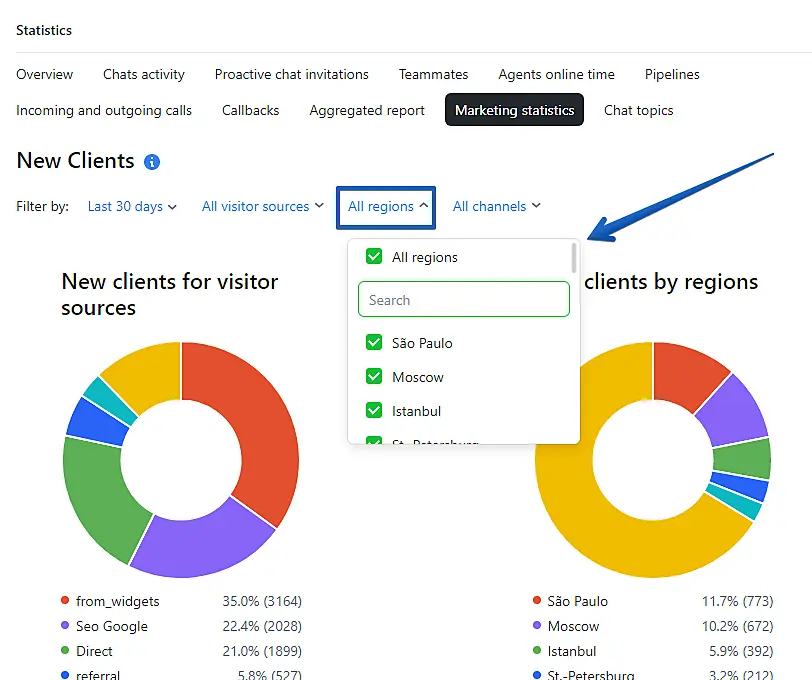
In the "Statistics" -> "Marketing Statistics" tab, you can start filtering by "Visitor sources"
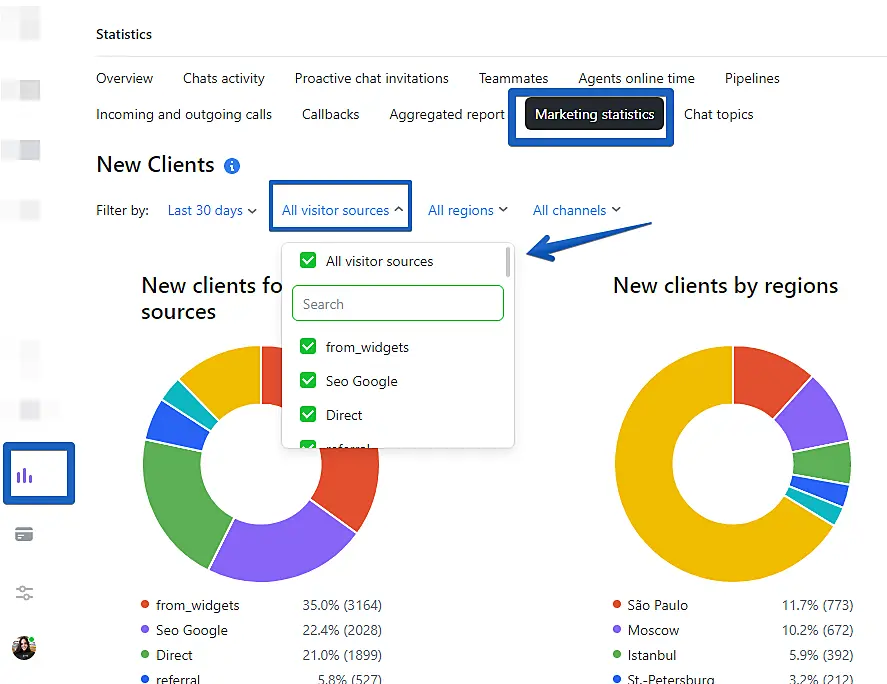
In the filter by regions, select the desired ones
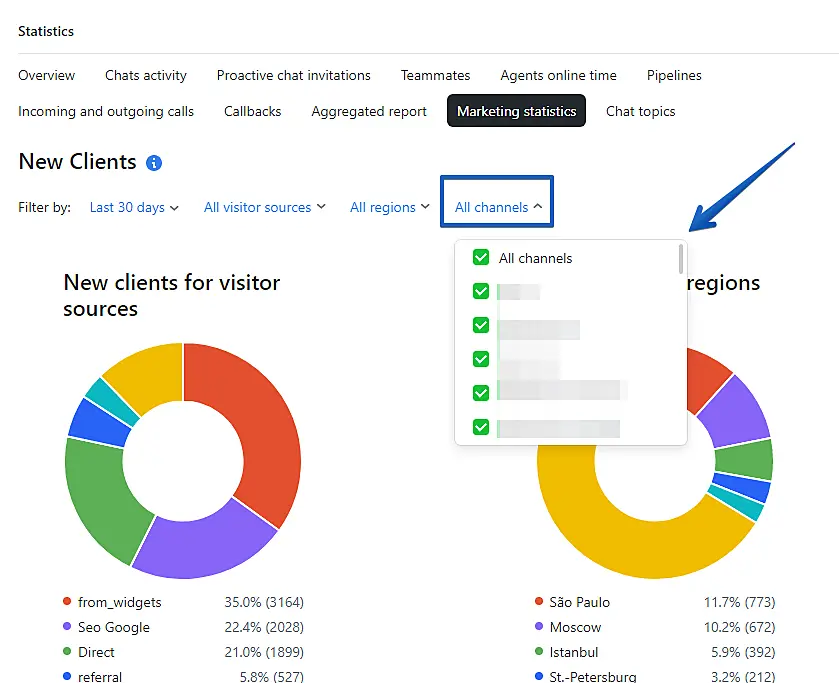
In the filter by channels, you can select the desired channels
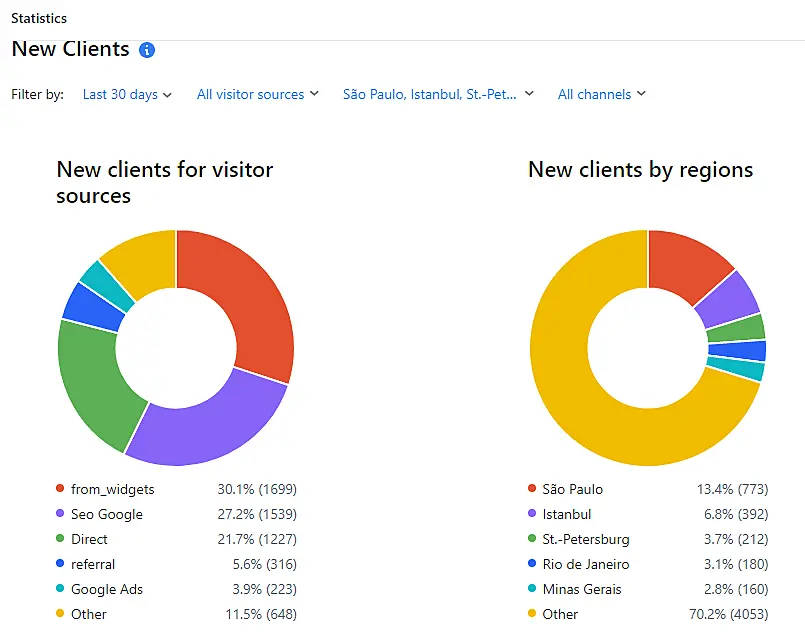
After filtering all the data for analysis, the pie charts display the information according to the selected period:
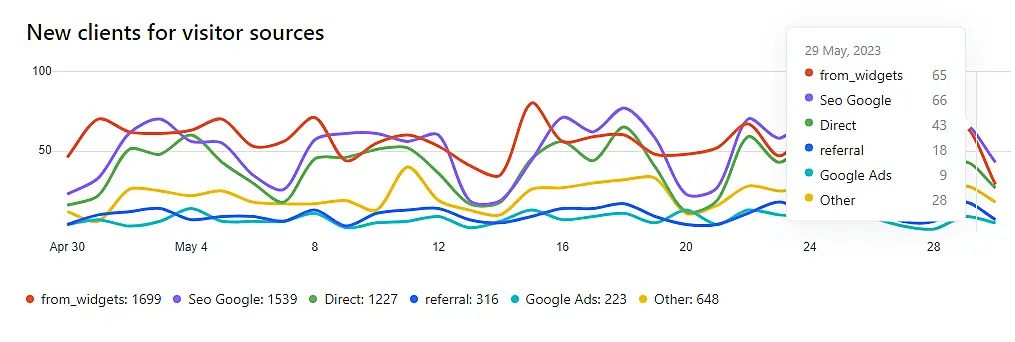
Below, you can see the graph in lines. By hovering the mouse pointer, you can see detailed information for each transition source.
That is all!
We hope this feature helps a lot in your everyday life.